


Pivot pivot! - All about pivot tables part 1
- Sep 20, 2017
- 1 min read

What are pivot tables?
A great way to summarise, analyse, explore, and present your data, creating them with just a few clicks
Are highly flexible and can be quickly adjusted depending on how you need to display your results
Great when data is dynamic
Example
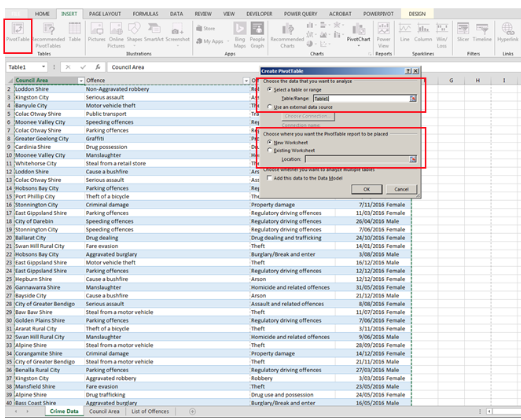
Using my Crime Data, I want to see how many offences were committed by both males and females in Ararat Rural City and Manningham City.
Note: the shortcut to insert a pivot table is ALT + N + V.
STEP-BY-STEP GUIDE (based on video)


I’ll click the down arrow next to “Row Labels”, untick “Select All” and select “Ararat Rural City” and “Manningham City”. In other words, filtering. Click OK.


Give pivot tables a go by replicating my example here: Crime Statistics
Notes: Categorical data and images of this tutorial are based on the following:
'Pivot' GIF sourced from giphy.com
List of council areas from State Government of Victoria, Victorian Local Councils - http://www.vic.gov.au/government-economy/local-councils/victorian-local-councils.html
List of offences and offence category from Crime Statistics Agency (CSA) - https://www.crimestatistics.vic.gov.au/
All other figures and data are my own and is for illustrative purposes only.
Comments